


La Tecnología hecha fácil en Español y ahora en English
Effective Monitoring of VMware vSphere Platforms with Grafana
Monitoring virtualization platforms is essential to ensure the stability and performance of IT systems in modern organizations. In this context, VMware vSphere stands out as one of the most widely used virtualization solutions worldwide, making it an ideal candidate for continuous monitoring. In this article, we will explore the importance and advantages of monitoring VMware vSphere platforms and how tools like InfluxDB, Telegraf, and Grafana can take monitoring to the next level.
VMware vSphere, which includes the ESXi hypervisor and vCenter control center, is a cornerstone in the infrastructure of many organizations. Ensuring that these platforms are operating at their optimal capacity is crucial for maintaining the continuity of IT operations. Here are some key reasons why monitoring VMware vSphere is fundamental:
Optimal Performance: Monitoring the performance of ESXi servers and virtual machines is essential to avoid bottlenecks and ensure that resources are used effectively.
Availability: Continuous monitoring helps detect and address availability issues before they impact end users.
Planning and Scalability: Monitoring provides valuable insights for capacity planning and future growth of virtualization infrastructure.
Security: Early detection of threats and vulnerabilities is vital to protect virtualized environments.
Grafana is an open-source observability platform that provides full control over data visualization. Here are some key advantages of using Grafana for monitoring VMware vSphere:
Effective monitoring of VMware vSphere with Grafana often involves additional tools to collect, store, and process data. Here, we highlight three essential tools:
Now that we’ve discussed the importance of monitoring VMware vSphere platforms, let’s see how to implement this monitoring solution. For this, we’ll use the following tools or software components: [insert names or details of the tools/components].
We are using the following software:
The architecture will be as shown in the following image, where we will have a virtual server with the Ubuntu operating system and the three (3) components installed and configured on the same server. Remember that this is just a demonstration lab and may serve for a small environment. If you want to implement it in a larger environment, you should consider separating the components and think about high availability configurations.
Creation of the VM in VMware vSphere and Installation of Ubuntu 20.04.6 LTS. In this step, I will skip the explanation and assume that you know how to create a VM in VMware and perform the default Ubuntu installation, where you only need to boot from the Ubuntu ISO and then click on the next buttons (….. NEXT, NEXT, NEXT). Just consider the following data when creating the virtual machine; I used the following data:
Name y/o Hostname: Grafana
vCPU: 4
vRAM: 8GB
vDisk: 100Gb
We validated the procedure on the official InfluxDB page
https://docs.influxdata.com/influxdb/v1.:8/introduction/install/
# wget -q https://repos.influxdata.com/influxdata-archive_compat.key
2.- Add REPOs
echo ‘393e8779c89ac8d958f81f942f9ad7fb82a25e133faddaf92e15b16e6ac9ce4c influxdata-archive_compat.key’ | sha256sum -c && cat influxdata-archive_compat.key | gpg –dearmor | sudo tee /etc/apt/trusted.gpg.d/influxdata-archive_compat.gpg > /dev/null
echo ‘deb [signed-by=/etc/apt/trusted.gpg.d/influxdata-archive_compat.gpg] https://repos.influxdata.com/debian stable main’ | sudo tee /etc/apt/sources.list.d/influxdata.list
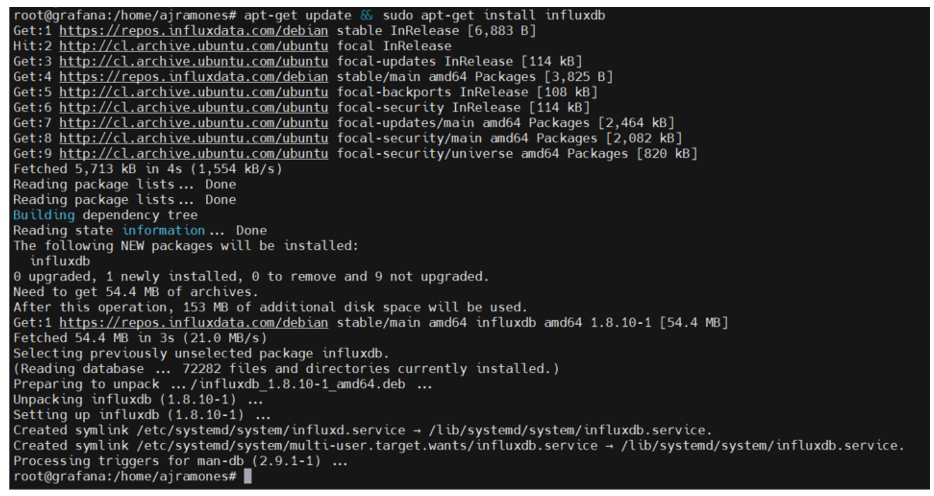
3.-After adding the GPG key and repository data, you proceed with updating and installing InfluxDB version 1.8.10-1. Here are the commands:
# apt-get update && sudo apt-get install influxdb
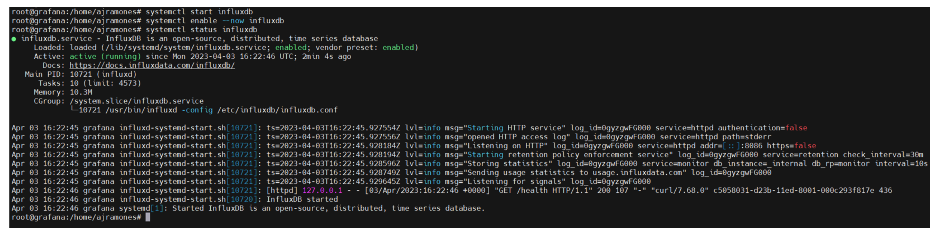
4.- We start the InfluxDB service and enable it to load automatically when the server starts, and we validate that everything is functioning correctly.
# systemctl start influxdb
# systemctl enable –now influxdb
# systemctl status influxdb
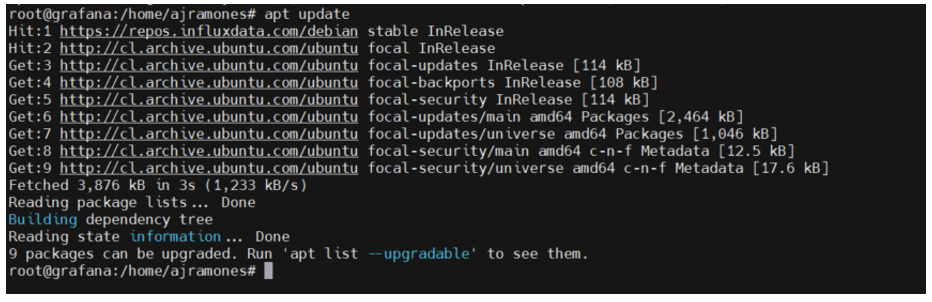
5.- We update the system.
# apt update
6.- We run apt list –upgradable to see the list of packages to be updated.
7.- We run apt upgrade to update the packages.
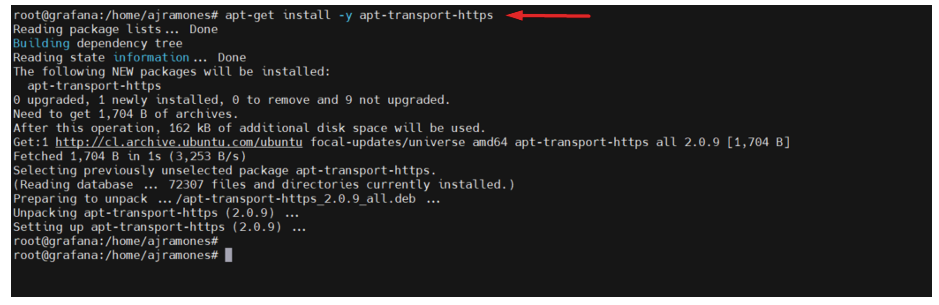
8.- INSTALL PREREQUISITES (Apache).
# apt-get install -y apt-transport-https
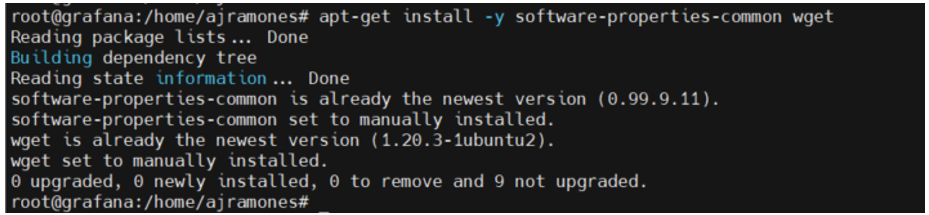
# apt-get install -y software-properties-common wget
9.- We download and import the GPG key.
# wget -q -O /usr/share/keyrings/grafana.key https://apt.grafana.com/gpg.key
10.- Add REPO of Grafana
# echo “deb [signed-by=/usr/share/keyrings/grafana.key] https://apt.grafana.com stable main” | sudo tee -a /etc/apt/sources.list.d/grafana.list
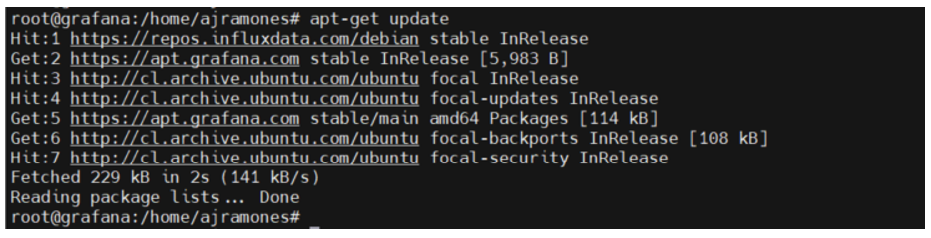
# apt-get update
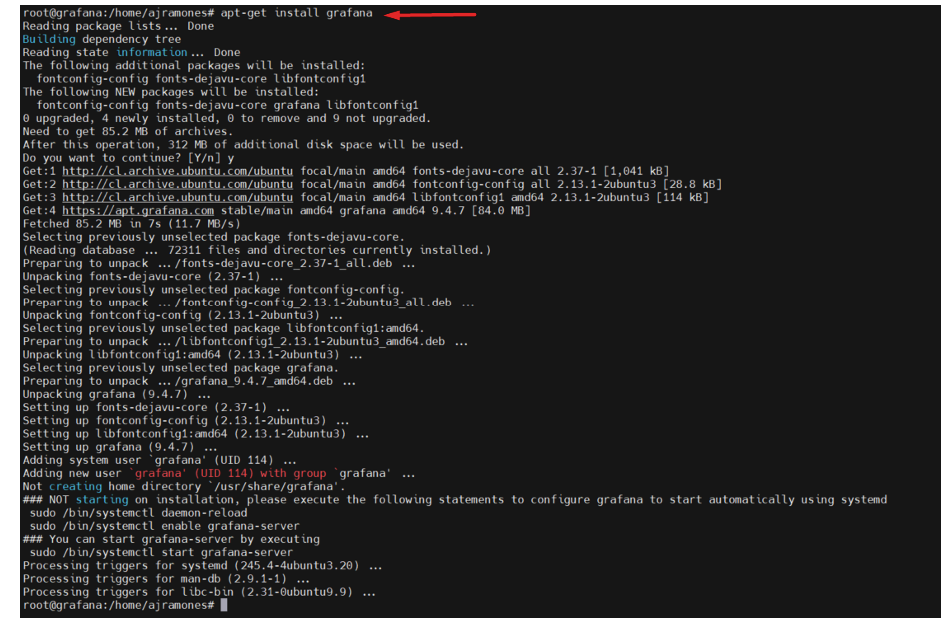
11.- INSTALL Grafana
# apt-get install -y grafana
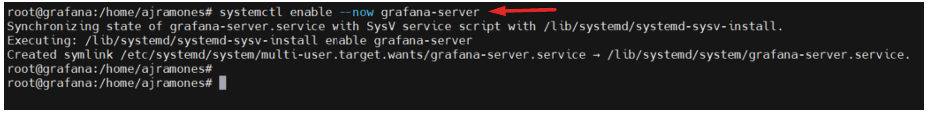
12.- Enable Grafana to start with the operating system.
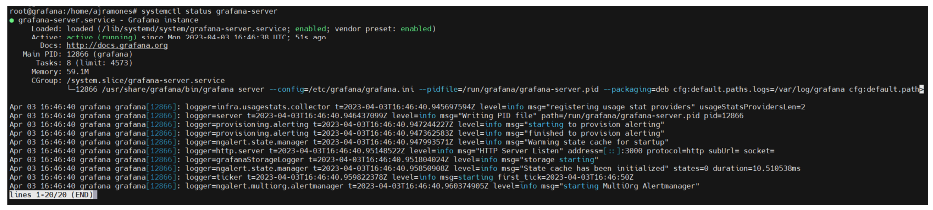
13.- Valide Grafana’s status
# systemctl status grafana-server
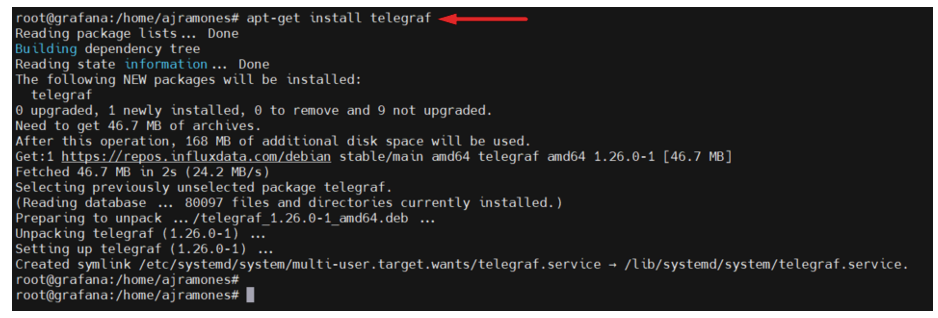
14.- Install telegraf
# apt-get install -y telegraf
15.- Backup the ORIGINAL file of configure of Telegraf
# cp /etc/telegraf/telegraf.conf /etc/telegraf/telegraf.conf.ORI
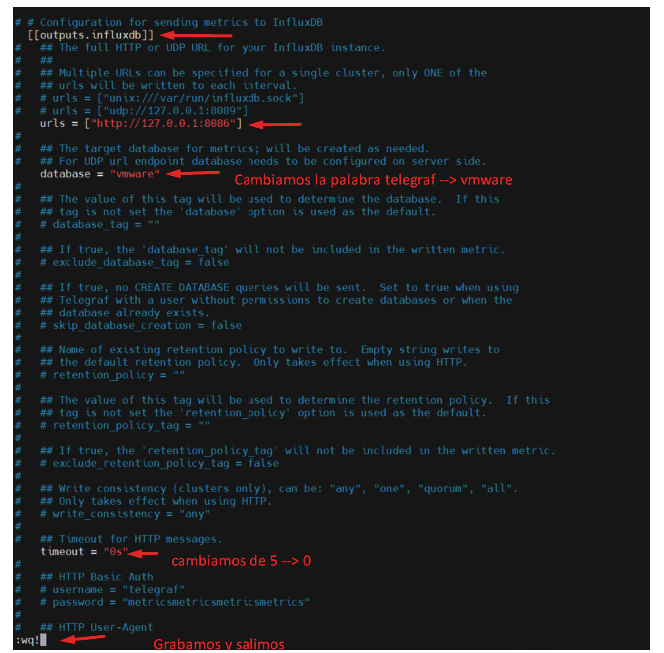
16.- Configure the necessary values in Telegraf
# vi /etc/telegraf/telegraf.conf
Search for the outputs.influxdb section
/ outputs.influxdb
and uncomment the following lines
# [[outputs.influxdb]]
# urls = [“http://127.0.0.1:8086”]
# database = “telegraf”
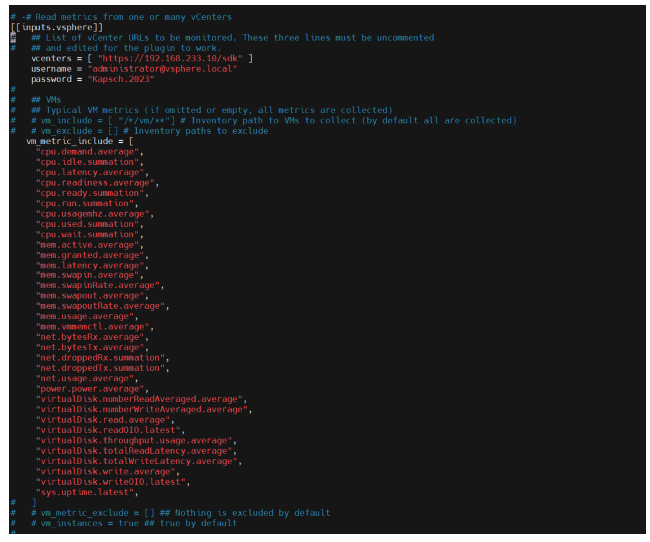
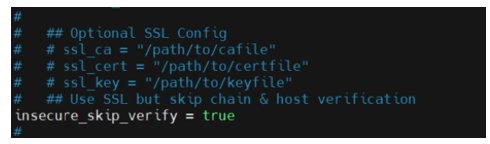
17.- Uncomment the values of the section VSPHERE that we want and put the value of access
For that search /vsphere
and change the following values
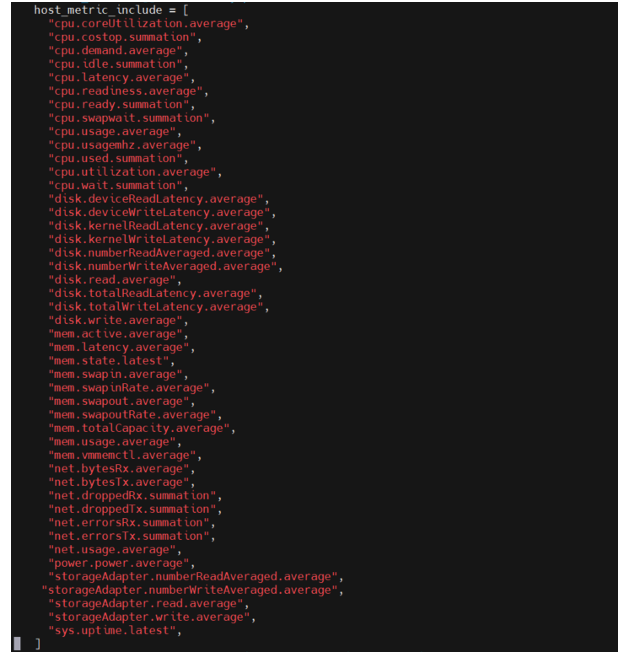
CONTINUE….
CONTINUE…..
CONTINUE…
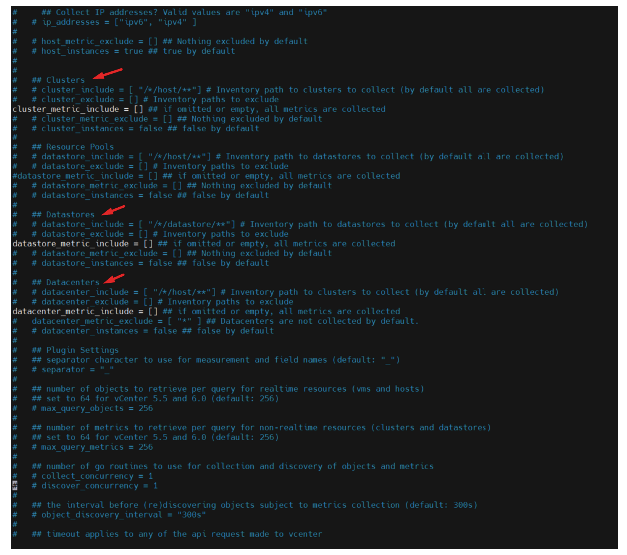
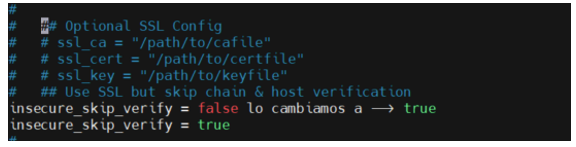
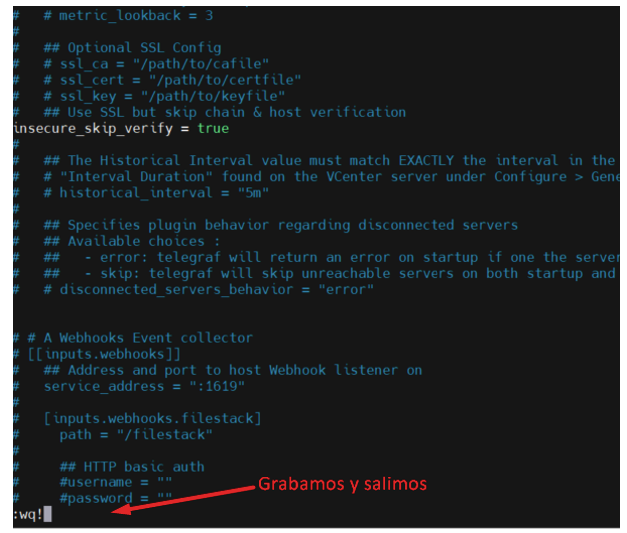
AFTER the change
SAVE and Exit
18.- Restart telegraf’s services and valide the status
# systemctl enable telegraf
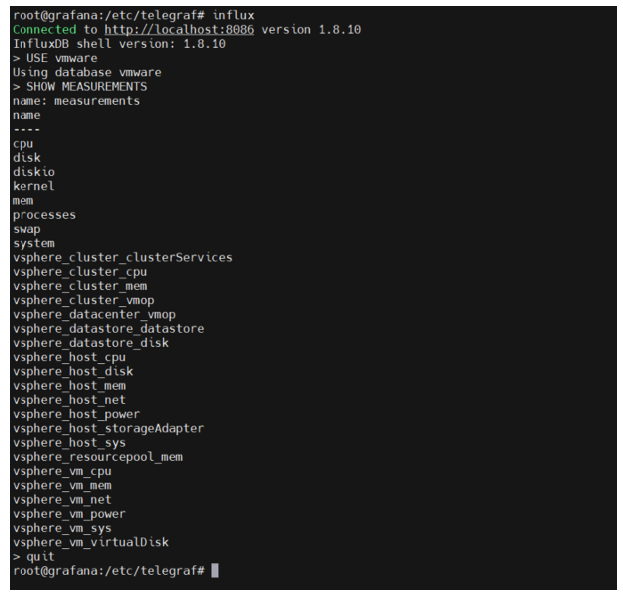
19.- Check the BD of influxDB
# influx
> USE vmware = Change to BD vmware
> SHOW MEASUREMENTS = Show métrics
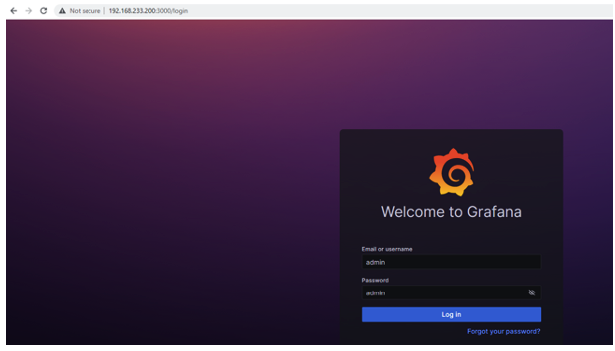
20.- NOW we are going to access Grafana through the web GUI.
https://ip-address-grafana-server:3000
For this, we use the following as the initial username and password:
USER:admin
PASS: admin
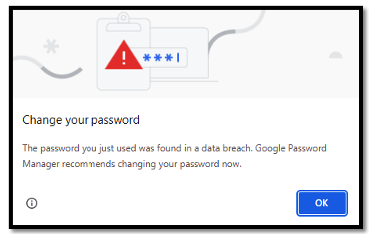
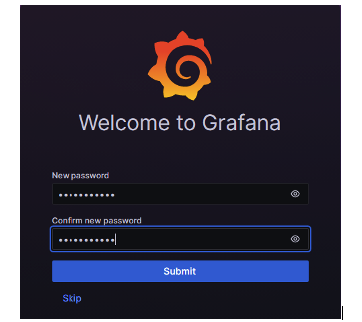
21.- Change the password
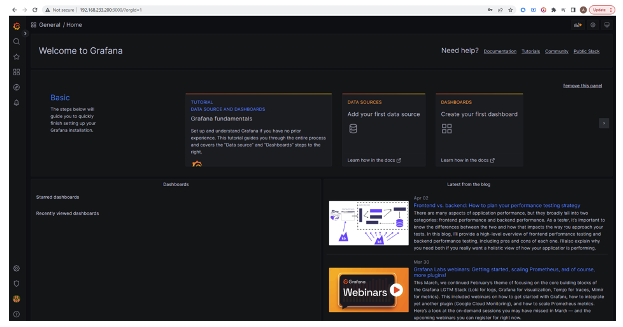
22.- Now you are in the Grafana Dashbord
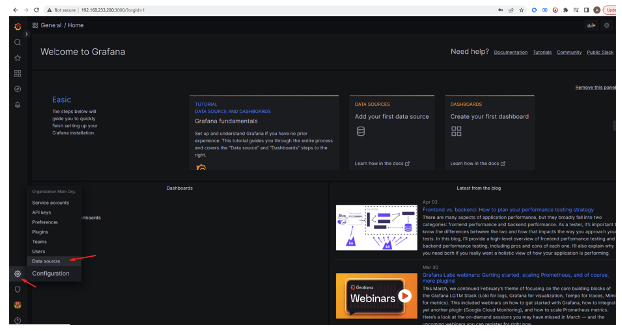
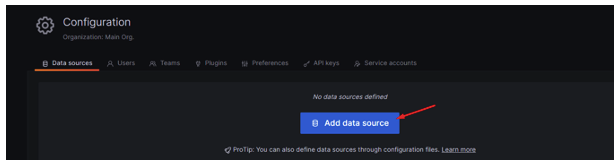
23.- NOW: In Grafana, we add InfluxDB as a data source.
24.- Clic on the bottom ADD DATA SOURCE
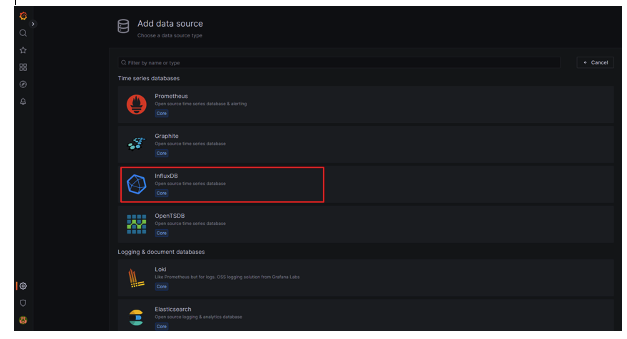
25.- Clic on InfluxDB
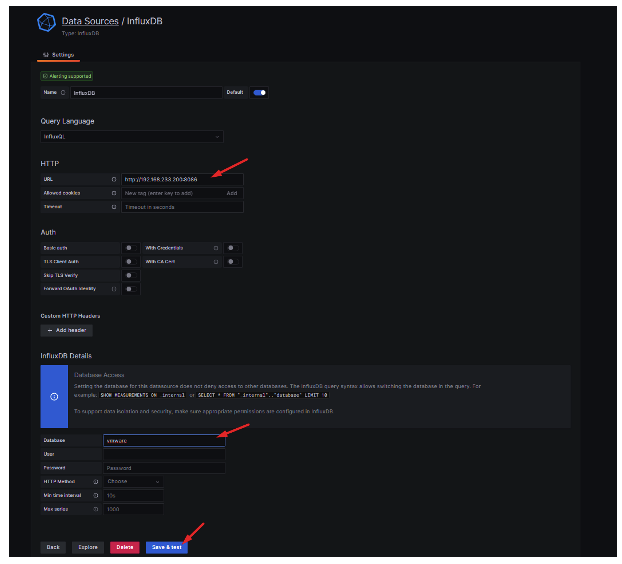
26.- Fill the field
En HTTP
URL: http://ip-address-influxDB:8086
InfluxDB Details
Database: vmware
Next clic on the bottom SAVE & Test
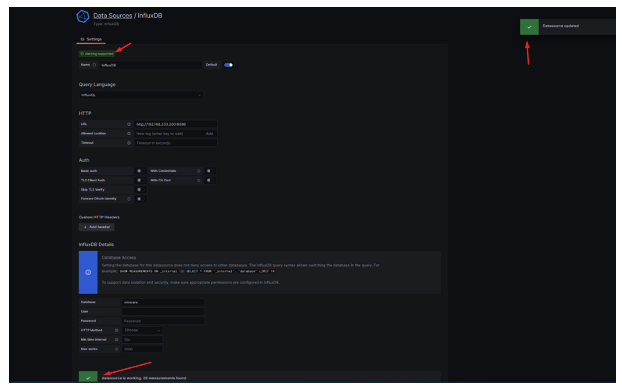
27.- We should see messages indicating that the database is updated, the data source is working, and the supported alerts, as shown in the following graph.
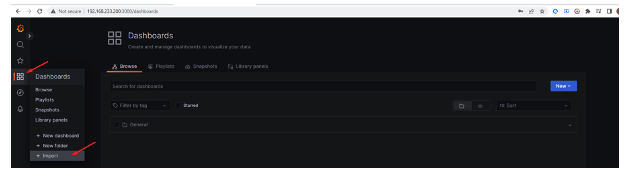
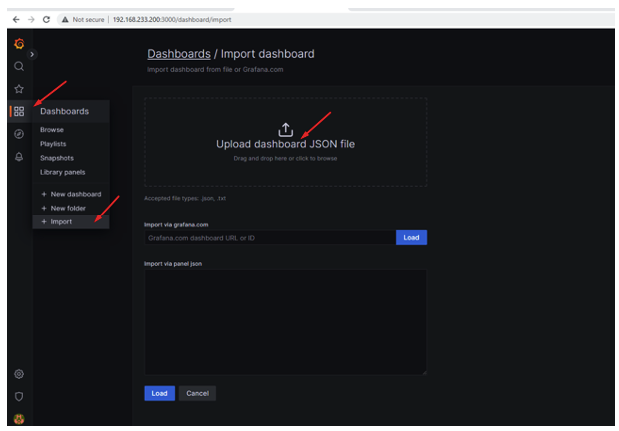
28.- NOW go to menú DashboardImport
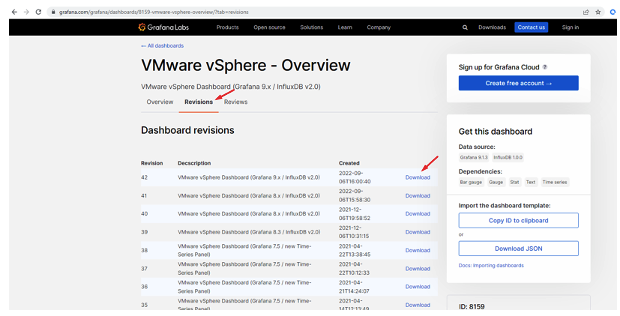
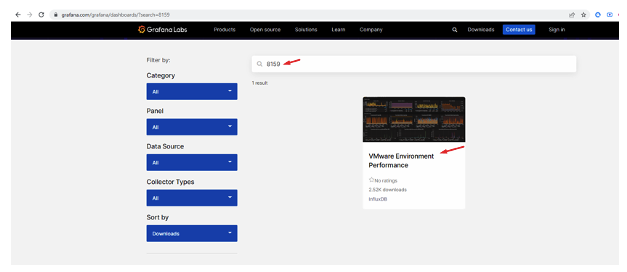
29.- In this menu, we need to import the Dashboards we want to use. To do this, first, we must download the dashboard from the website.
https://grafana.com/grafana/dashboards/
To follow this example, we download dashboard 8159 revision 38.
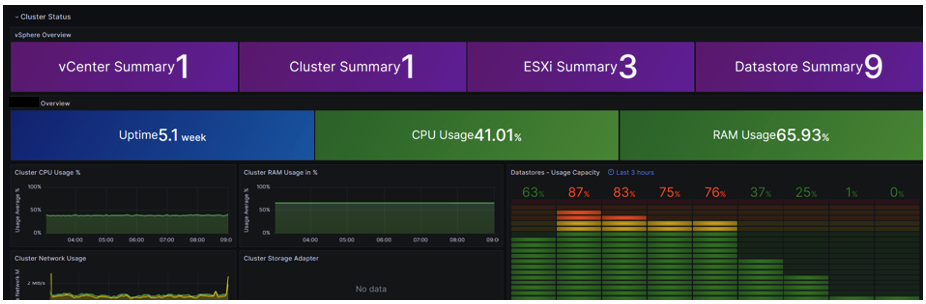
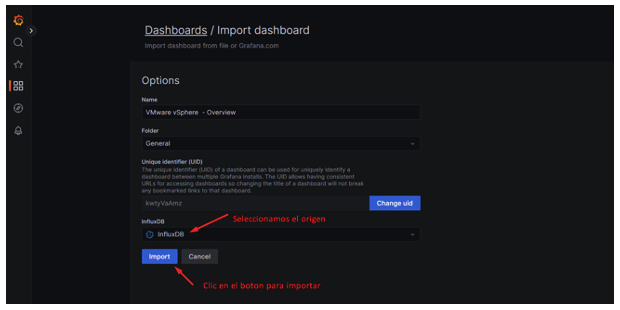
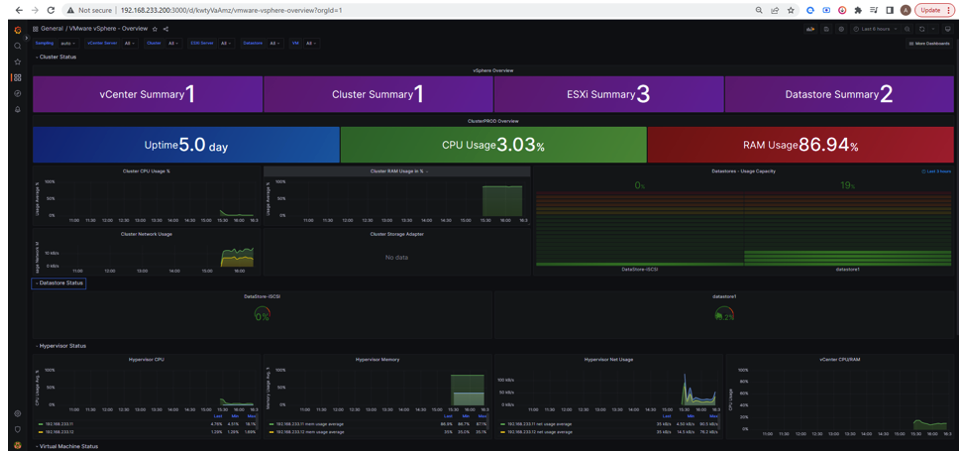
30.- Now that we have the JSON file, we import it for the Dashboard. Click on “Upload dashboard JSON file” to select the file.
And WALAAAA, we start to have our monitoring.


